Green doesn't mean good: what portfolio dashboards hide
A wall of green status can hide drifting programs, stale updates, and investments that no longer match their business case. Here's what delivering portfolios do differently, and two programs that turned around without changing the technology.
Here’s what a technology portfolio review often looks like at the leadership level:
- Green status across 14 of 16 programs
- Spend within 5% of forecast
- Timelines holding
- Milestones met
And here’s what’s often actually happening:
- Three programs are green because nobody updated the status since last quarter
- Two programs are on track for milestones that no longer map to the original business case
- The spend looks clean because three work orders haven’t been submitted yet
- The two red programs are getting all the attention, while the quiet yellow ones are where the real risk lives
This isn’t dysfunction. It’s information architecture. Most portfolio reporting systems are designed to aggregate status, not to surface risk. They answer “are programs on schedule?” without asking “are programs delivering the right thing?”
The executives looking at the green dashboard aren’t being deceived. They’re working with the data they have. The missing layer is the connection between program status and business outcome, and in most organizations that translation doesn’t happen automatically. Someone has to build it.
Green doesn’t mean good. It means the report was updated.
What delivering portfolios have in common
After reviewing technology portfolios across multiple organizations and industries, a pattern emerges. The ones producing consistent value share four things that struggling portfolios almost never have.
- A defined connection between capability and business outcome. Not “this system supports operations.” Specifically: this capability reduces X by Y%, which translates to $Z.
- Governance that makes decisions, not just documents them. High-performing portfolios have steering structures that can approve, pivot, or kill a program in a single meeting. Struggling ones have committees that produce minutes.
- A realistic cost model for capability, not just implementation. Implementation is roughly 30% of the cost. Adoption, training, ongoing optimization, and technical debt are the other 70%, and both belong in the budget from day one.
- A single owner accountable to the business, not just IT. Not a project manager. Not a vendor relationship owner. A portfolio leader who translates between technology investment and business language, fluently, in both directions.
None of these are technology decisions. All of them determine whether technology investments work.
Two programs, same lesson
Three months from being cancelled
Two years into a technology program, with significant investment committed, leadership was quietly building the case to shut it down. Not because the technology wasn’t working, but because nobody in the room could answer one question: what are we getting for what we’ve spent?
The technical team had delivery metrics: sprint velocity, deployment frequency, defect rates. All green. The business had nothing. No measurable outcome, no before-and-after comparison, no story they could tell the CFO.
The program wasn’t failing. The translation layer between technology delivery and business value was missing. Three structural changes fixed it:
- A business outcome register created alongside the technical backlog
- A capability owner from the business assigned to every major workstream
- A 60-day value report written for finance, not IT
Six months later, the same program was being held up internally as a model for how technology investment should be managed.
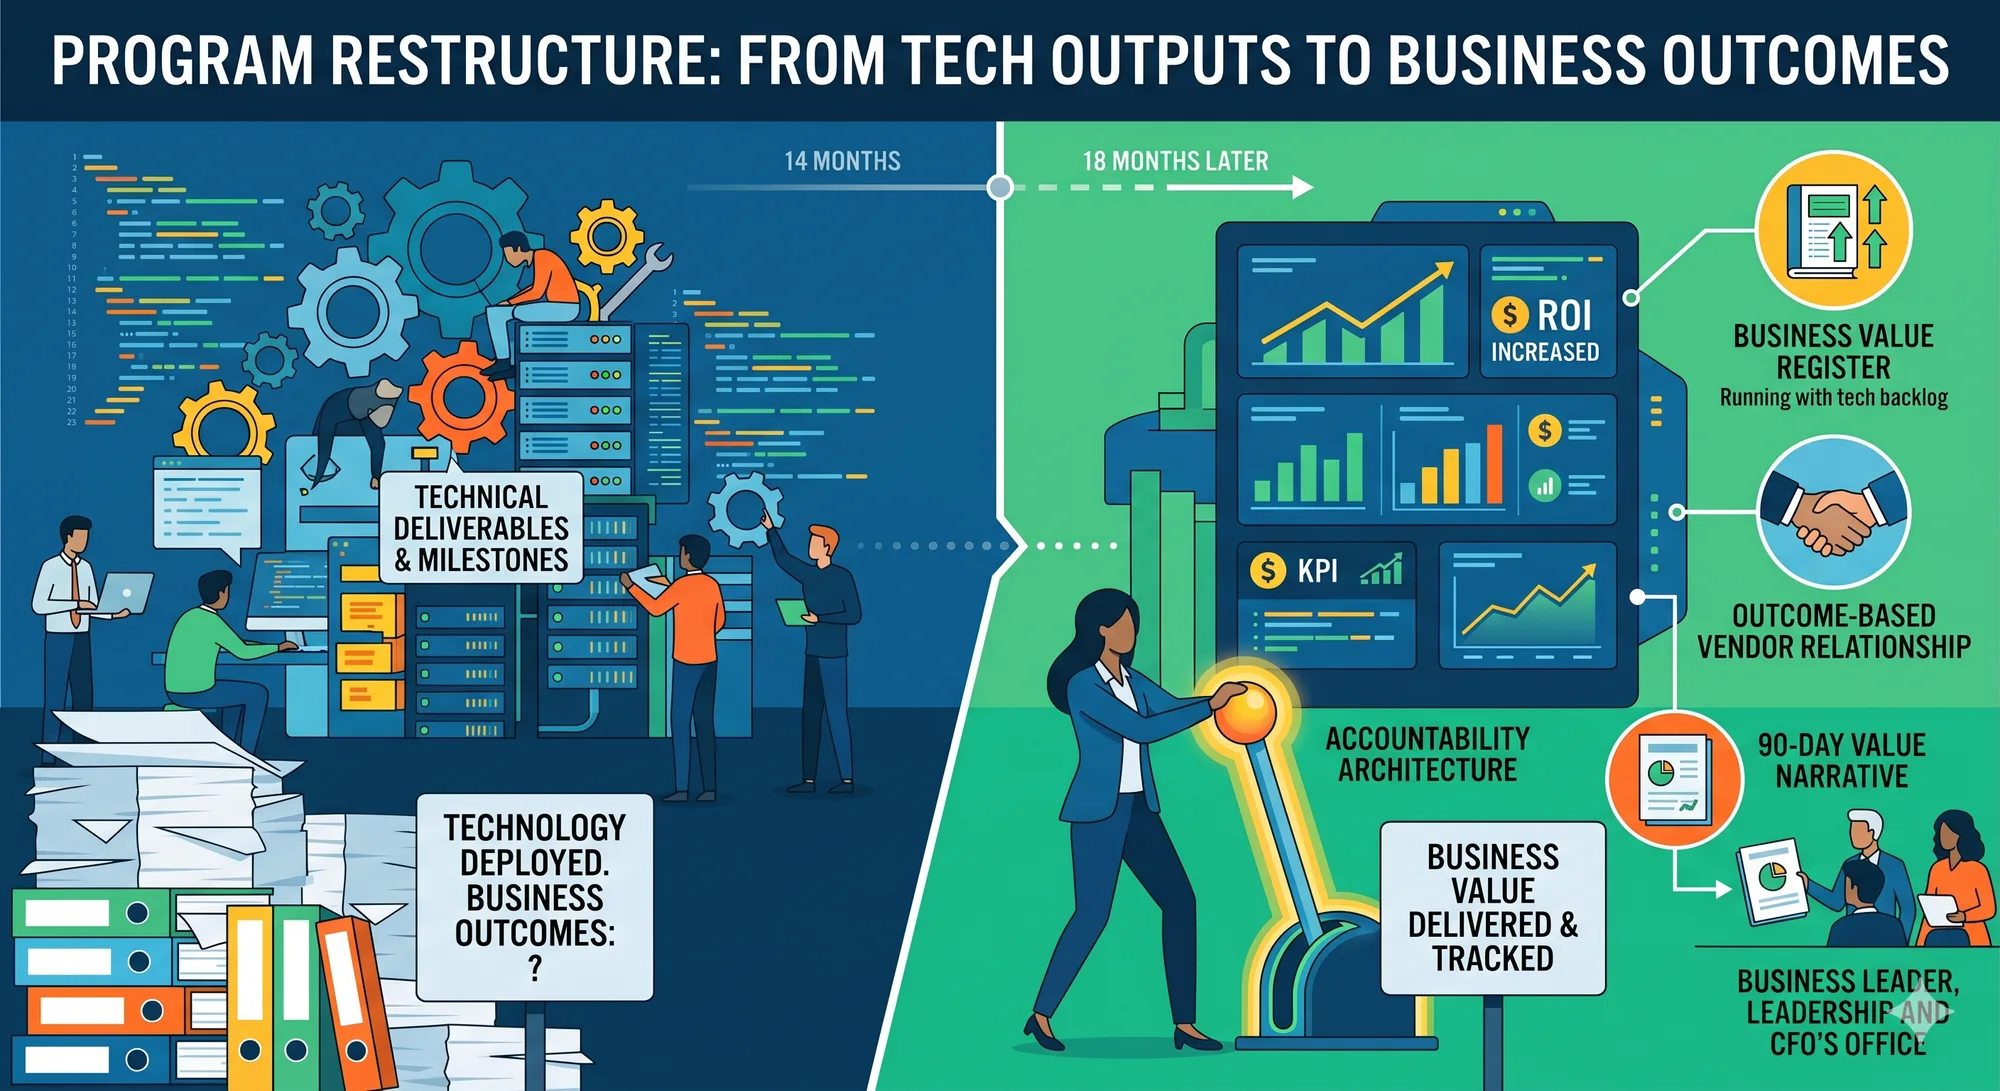
Fourteen months in, nothing had changed
A different program had been running for 14 months, with multiple vendors and significant spend, and the business unit couldn’t point to a single workflow that had materially changed. Milestones were being met. Deliverables were being accepted. But the business outcomes that justified the investment weren’t in the reporting at all. Nobody tracked them. Nobody owned them.
The program had been built to deploy technology, not to deliver business change.
Three structural interventions
- OwnershipA business value register
Parallel to the technical backlog and owned by the business unit director, not IT. Every quarter, one measurable outcome had to move.
- VendorsContracts restructured around outcomes
Milestone acceptance criteria were rewritten to include a business condition, not just a technical one.
- VisibilityA 90-day value narrative
A standing document, updated quarterly, translating program activity into business language and shared with the CFO's office.
Eighteen months later, that program’s business case was cited in a budget planning session as a model for how technology investment should be managed.
Same technology. Same team. Different accountability architecture.
Which of the four traits does your portfolio have? Which one is missing?